Recently having got access to India’s export data based on the states of origin, it was finally possible to delve into the composition of each state’s exports. To begin with I decided to analyse the exports from the state of Karnataka.
This exercise is going to be the first step to a multi-step agenda. Step 1 of the agenda is to first visualize the composition of the state’s export basket. Step 2 is to understand the structural reasons for the given export composition. Step 3 is to look at possible issues being faced by the products basket in focus. Step 4 would be to provide a prediction for the exports and finally if enough insight has been got then a useful input to improve the same.
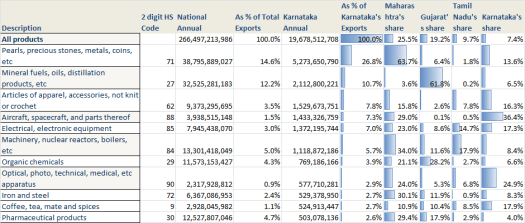
Given below is the breakup of the top exports by value for Karnataka for the period of January-December 2015. Karnataka is the 4th largest exporter with a total share of 7.4 % in the total merchandise exports of India. Thereafter I have added some comments on some of the export product groups of Karnataka based on my own understanding. The explanations are often conjectural and no statistical testing has been done for some of the points I have given.
Pearls, precious stones, metals, coins
This follows the nationwide trend wherein raw gold and uncut diamonds are imported into India. Finished jewellery and stones are exported out after processing in the various units. Usually these units are based in SEZs or EOUs to avoid incidence of taxes. According to 2014 trade data, India has around 6% share in the exports of this product group.
Mineral fuels, oils, distillation products
The reason for export of these items from Karnataka is possibly because of location of the Mangalore Refinery and Petrochemicals Limited in Karnataka. However, the lion’s share in this product category of about 62% is with Gujarat probably because of the Reliance owned refineries in Jamnagar. India seems to have a comparative advantage in petroleum refining. What gives it the edge can be looked into in another post.
While the above 2 product groups would be in the export basket of all major exporting states, the rest of the product groups are discussed because of certain factors endemic to the state.
Aircraft, spacecraft, and parts thereof
This happens to be the 4th largest exports from Karnataka. Data shows that 8403(aircrafts parts) take up 20% of this product group. The remaining 80% is for export of 8402 (complete aircrafts).
The presence of HAL in Bengaluru has led to the development of aerospace ancillary units around it. Over time they would have started catering to the international market as well. Some of the units that I happened to come across import blocks which they chisel into aircraft machine parts on CNC machines.
The 80% block of complete aircrafts is unexplainable because as far as I know India does not manufacture any aircrafts. Except if it related to the Aviation MRO (Maintenance, Repair and Overhaul) industry. There is a rise in outsourcing of Aviation MRO activities to India, wherein the entire aircraft is brought into India and the plane is then repaired and overhauled. For example, after a certain number of flying years a passenger aircraft is converted into a cargo aircraft by removing the seats etc. and overhauling the complete craft. This is a labour intensive work and India is ideally suited for such an industry. The value addition in this would be low I guess, but the overhauled aircraft’s value would be present both in the import and export figures and hence the high value of 80%.
For the product group in general, with 42% of the total share from India, Karnataka definitely stands out. At this point, an insightful policy could definitely help the sector move up the value chain in the aerospace sector globally.
Articles of apparel, accessories, not knit or crochet
Textile and textile articles are a big section under the HS classification having 14 different product groups which including knit or not-knit cotton, silk, wool and synthetic fabrics. India is traditionally a big exporter of textiles especially in the non-synthetic categories. The particular group of not knit apparel accounts for a share of around 4% in the world exports for India. Within India Karnataka has the largest share of around 16% after Delhi which leads by 27%. Digging further into the product group, men’s shirts, women’s blouses and trousers account for over 50%. Essentially, these exports are tailored items made in workshops around Bangalore. Firms like Gokaldas and Raymond’s are regular exporters that I am aware of.
However, if we were to look at other textile groups like knitwear, Karnataka has only 5% share while the majority of around 43% rests with Tamil Nadu because of the textile clusters in and around Tirupur.
Silk
While Silk is not a big export for Karnataka in terms of value with a share of only 0.4% of the state’s exports, it is still worth mentioning as 70% of the total Silk exports from India originate in Karnataka. The silk industry also exists in other historical towns like Varanasi, Kachipuram, Chanderi, Bhagalpur, Varanasi, Pochampalli, Thanjavur etc, but it looks like the exports seem to be concentrated out of Mysuru and Bengaluru only.
This requires some explanation. My guess is that Mysuru silk has gained some kind of recognition and recall in the apparel industry abroad. Further, given that Mysuru has been exporting silk for a long time, the aggregators for Silk are possibly based out of Mysuru and Bengaluru. So even exports from other states are possibly aggregated by buyers in Karnataka and that then bundled out for exports from there.
Coffee, tea, mate and spices
India has long been an exporter of Coffee, tea and spice and has a share of around 5.6% in the world exports. In this Karnataka has a share of 17.6% which is the highest after Kerala. Value wise the largest exports in this group are Coffee and Cashew. Karnataka has an advantage purely based on geographical conditions available in the state. Some items under this group like the monsooned Malabar Coffee (both Robusta and Arabica verities), Coorg Green Cardamom, Byadagi Chilli are listed as geographical indicators as per the GI Act 1999. The monsooned Malabar coffee is prepared by exposing the harvested beans to monsoon rains so that the original acidity is gone and it gives a better flavour profile. These coffee beans are completely endemic to Karnataka and Kerala.
Optical, photo, technical, medical, etc. apparatus
This product group accounts for only 1% of India’s exports. However, Maharashtra and Karnataka account for 25% each out of this 1%. This could probably be explained by the presence of subsidiaries of global MNCs like GE Health, Carl Zeiss etc. operating out of these states. Since they would be integrated into the MNCs’ regional value chains they would also be supplying to other countries where the MNC has presence. Major items under this group are 9022(X-ray tubes, parts of X-rays), 9033(automated regulating instruments), 9011(spectacle lenses).
There are product groups that I have skipped for now. Going forward I will try to provide more explanations and with better info graphics.

Hey.. very insightful!!!! I really wonder where you got the data, I would be grateful if you could share the sources from which you obtained the data. This is for my research.
LikeLike